
A learning curve – the only way to describe the journey of UOSM2008. Using the Smyth (1989) template for self-reflection, the following summarises my progress and thoughts throughout the module.
1. Describing – The UOSM2008 Experience
What did I do?
This module entailed starting a blog, which served as a platform for the fortnightly process of posting, commenting and reflecting upon a specific topic, relating to the online World.
The graphic below outlines each stage of the procedure in more detail.
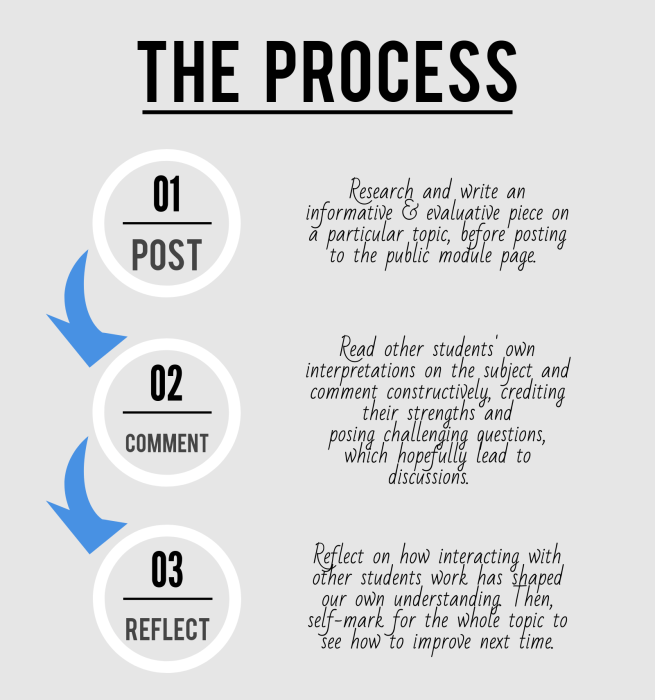 Dekkers (2018) created using the software Piktochart
What did other people do?
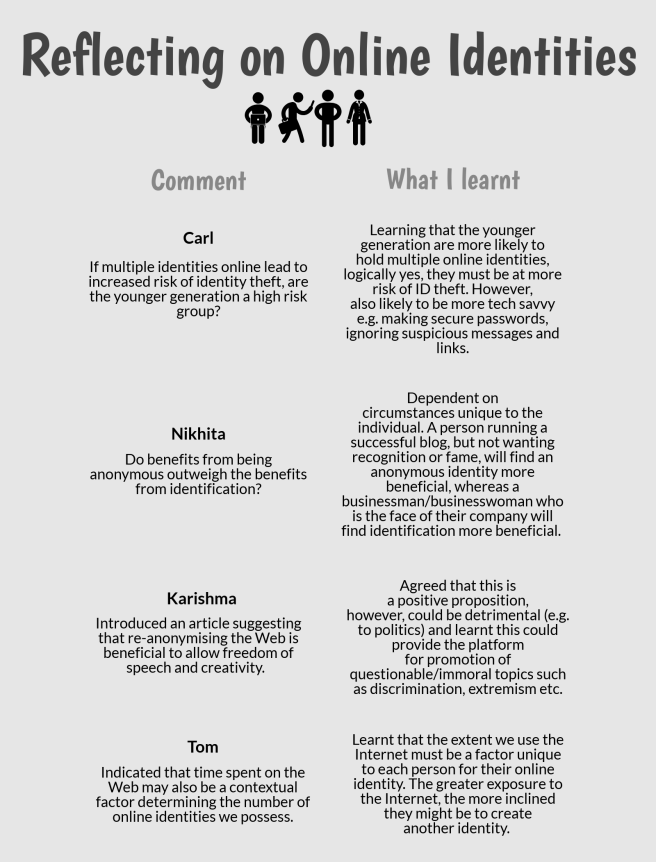
Not only did other students shape my comprehension through their own individual pieces, comments posted on my own interpretation provided me with constructive criticism and caused me to re-evaluate my initial thoughts.
2. Informing – Additional Background
Why did I enrol in UOSM2008?
Having completed modules virtually all specific to my degree, I wanted to try something different. Living and Working on the Web offered insight to an innovative way of learning and after reading the module assessment, alleviating an exam from my usual ‘end of semester schedule’ was an additional bonus.
What was I feeling at the start of the module?
During the first instructional lecture, it was explained that by the end of the course, we would be self-producing infographics and videos. Coming from a subject where constructing Excel tables was the extent to my digital creativity, I was apprehensive toward my capability of meeting the technological requirements. I did however, hope it wasn’t going to be too burdensome, considering that students from any faculty could enrol. Interacting with individuals that held different strengths to me was another prospect I looked forward to.
Moreover, it would be untruthful to say I wasn’t skeptical about learning in the way UOSM2008 proposed. Would it really be as effective as traditional face-to-face contact?
What were my strengths and weaknesses?
To begin with, it was apparent I was fairly competent at grasping the research and writing analytically aspect of the course, which I believe I was able to carry throughout. However, my creativity was at best, basic. Looking back at my first post, I think it fair to say I’ve made drastic progress, from using secondary infographics and videos to now creating my own.
Self-evaluating was another element I improved greatly upon as the course proceeded. By the last topic, no amendments had to be made by my assessor to what I had scored myself.
Although referencing was something I had not anticipated on struggling with, I attained lower marks in comparison to other criteria in the first couple of topics. This is because, being used to basic Havard referencing in essays, I was unaware that I had to cite my own material (with my surname etc) and failed to hyperlink sources within the text, although I was able to rectify this fairly easily.
The infographic below summarises my main strengths and limitations during the course.
 Dekkers (2018) created using the software Piktochart
3. Confront – Self-Awareness
What was I aiming to achieve during this module?
My main aim for this course was to become familiar with a greater variety of software and tools available to me on the Web, for example, WordPress. Furthermore, I wanted to improve on my general reflecting and evaluative skills, which are invaluable to everyday life. Lastly, as a student who personally performs better in exams and is more lax when it comes to coursework, I aimed to improve my self-discipline and ability to meet deadlines. The below infographic summarises how my self-rating on various criteria has changed from the start to the end of the module.

Dekkers (2018) made with the software Piktochart
What values & beliefs impacted my approach to the module?
My belief that learning via the Web would be “easier” and “less time-consuming” was quickly reviewed during the introductory topic. Making valuable remarks on another’s work and responding to comments in a way which would be beneficial to my peers was something I definitely found challenging. Assuming this was something I already did before this module, I now realise it is something I rarely carried out and I now see the value in such an activity.
4. Reconstruct – Looking to the Future
What problems did I encounter & how did I overcome them?
Although I am pleased to say I didn’t encounter any major issues, struggling with the simplest tasks, such as setting up my blog, navigating WordPress and sourcing video and infographic software became minor setbacks in the initial stages. After some persistence and consulting other peers’ blogs and Google, I was able to overcome these issues.
What opportunities are available to me now?
Stating my newly found acquaintances with graphic software is likely to contribute to my employability and if blogging were to be of interest to me later in life, I would definitely have a good head-start. UOSM2008 has also allowed me to see the many advantages to virtual learning environments, through exposure to the MOOC. It has provided me with incentive to participate on such platforms, which I’m sure I otherwise wouldn’t.
How will I carry through what I’ve learnt to my everyday life?
The video below summarises what I gained researching and reflecting on each of the topics.
Final words – how have I been impacted by UOSM2008?
The journey of UOSM2008 has been thoroughly enjoyable and worthwhile. My original skepticism about learning through the Internet had been completely eradicated and I can truly see the benefits to living and working on the Web, significantly more than before.
[Word count: 897]
Bibliography
Smyth, J. (1989). Developing and sustaining critical reflection in teacher education. Journal of Teacher Education, 40(2), 2-9

 Dekkers (2018) created using the software Piktochart
 Dekkers (2018) created with the software Piktochart
 Image from Linalindberg (2015)
 Infographic made with Piktochart
 Individuals Using the Internet (% of Population) – Graph made in World Bank (2017)
 Infographic made with Piktochart
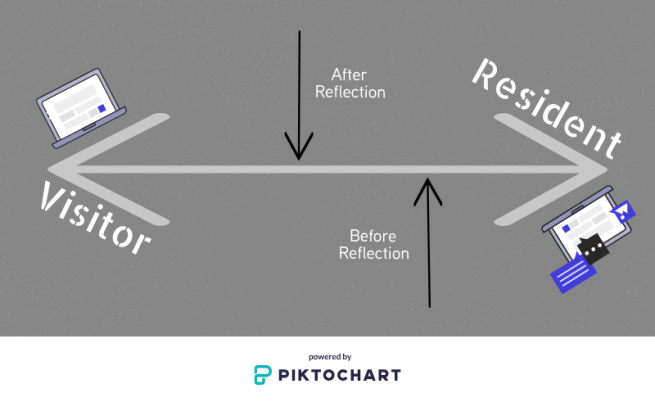
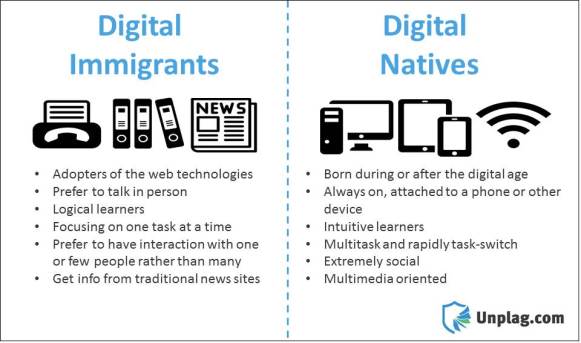 Figure 1: Digital Immigrants vs. Digital Natives (Unicheck Team, 2017)
